Half a season is complete and this is the current group summary- where we rank against each other and what our average table looks like. I’ve created a single page for each user and you can link through to each using the “Series” on the menu bar over on the right-hand side.
Overall Leaders
It’s been good for me so far as once again I end the halfway point in the lead. I just need to avoid a second-half Watford slump… or a Liverpool special (leading at Christmas and failing to hold on).
| Season | Team | PPM pre-25 Dec | PPM post-25Dec | Final pos |
|---|---|---|---|---|
| 2008/09 | LIV | 2.17 | 2.35 | |
| 2009/10 | CHE | 2.28 | 2.25 | 1 |
| 2010/11 | MUN | 2.13 | 2.09 | 1 |
| 2011/12 | MCI | 2.59 | 2.14 | 1 |
| 2012/13 | MUN | 2.39 | 2.30 | 1 |
| 2013/14 | LIV | 2.12 | 2.29 | 2 |
| 2014/15 | CHE | 2.47 | 2.14 | 1 |
| 2015/16 | LEI | 2.24 | 2.05 | 1 |
| 2016/17 | CHE | 2.53 | 2.38 | 1 |
| 2017/18 | MCI | 2.89 | 2.37 | 1 |
*This chart conveniently begins with 2008/09 as the failing to win from top position was fairly common when the EPL was still competitive.
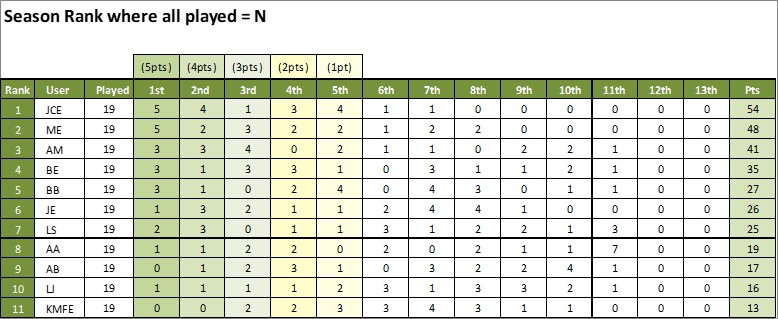
So I’m sure you are wondering where you rank and …. drumroll…..here is the table. This table has not accounted for some people not playing each week which is why some scores are low (AA only played 14 weeks, for example).

Here I used a more Formula 1 based scoring system – admittedly somewhat arbitrary choice of points but gives a slightly different view. It gives AM some credit for his better 3rd / 4th place finishes over BE despite scoring lower overall – it rewards performance consistency.
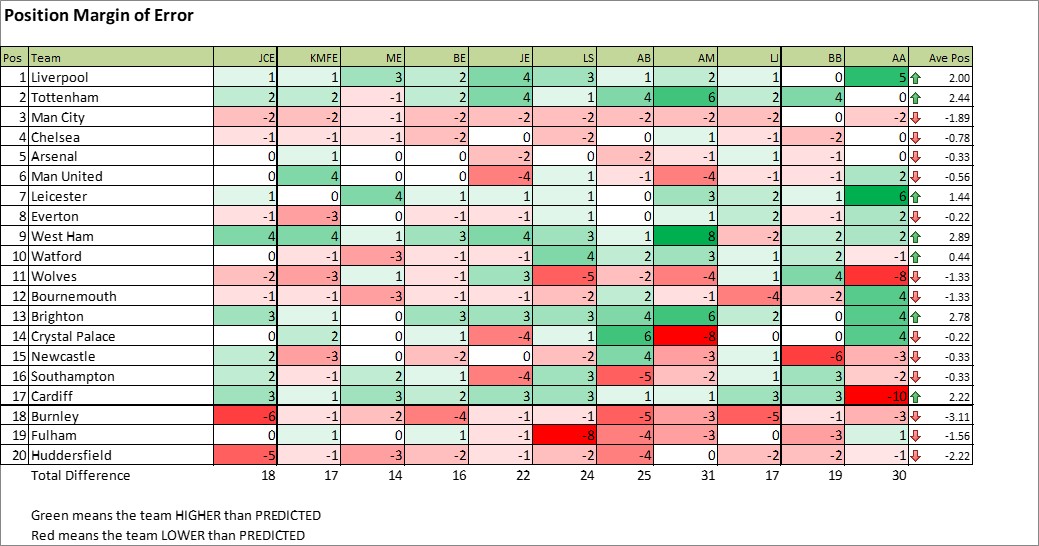
In case you were curious- I created a table based on the average of all the players that picked all 19 games. This was to remove the Man U, Liverpool, Man City, and Spuds bias that everyone brings into their weekly picks. Check out ME’s table for example – Spuds walking it!

And Finally – a summary that shows where everyone picked a team and where that team is. Obviously, Burnley and Huddersfield are my this year’s West Brom – should I keep picking them to draw and win?